Q3 2022 Investment Trends features in-depth and up to date insights on demand drivers and other key investment trends in Australia, mainland China, Hong Kong SAR, Taiwan, Japan, Korea, India, Singapore, and New Zealand.
The Asia Pacific flexible office space market continued to display cautious growth in 2022, with the total volume of flexible office space in the region reaching 76 million sq. ft. as of September, an increase of 6% y-o-y on 2021 and 15% on pre-pandemic levels.
As of September, flexible office space accounted for about 4% of total office stock and 3% of total Grade A office stock in Asia Pacific. In the Grade A segment, India and Singapore reported the highest penetration of flexible office space, while most North Asian markets are just below 2%.
Tech firms and business services companies remain the top corporate users of flexible office space. Interest is also growing among financial, life science and consumer product firms.
Trends that will continue to shape the flexible office landscape in 2023 include:
Flexible space operators offering on-demand memberships to cater to more dispersed workforces resulting from the widespread adoption of hybrid work
Growing occupier demand for customised enterprise and turnkey solutions to mitigate rising fit out costs and CapEx constraints
The use of asset-light strategies as flexible space operators form partnership with landlords using management contracts
Case Study of Mass Timber Construction – GDI Property Group (Australian REIT)
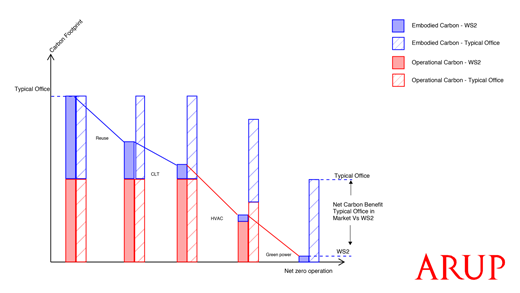
GDI Property Group (GDI), an Australian listed REIT headquartered in New South Wales, Australia, is currently constructing Perth’s first hybrid mass timber and steel frame office building. GDI will utilize a mix of cross laminated timber and steel to construct WS2, an 11 story, 9,500 square meter office building with the goal of creating a best-in-class, sustainably focused asset.
GDI underwent extensive research to understand both the environmental and economic impacts of developing what they’re calling Perth’s most environmentally friendly premium grade office building. Upon completion in late 2022, WS2 will boast a 5-star NABERS Energy Rating, a 5-star Greenstar Rating and will show a reduction of carbon by approximately 50% over the building’s lifespan vs. a similar al concrete/steel-based building and a reduction of 80% embodied carbon during the construction phase. This reduction will be captured through a combination of offsets, renewable energy systems within the building, and significantly lower embodied carbon during the construction phase. Ultimately, the goal is to achieve net zero operation, lowering scope one and two emissions, while achieving a better economic outcome as timber construction is “quicker and cheaper to build on a Total NLA Basis” according to the company in their 10 November presentation.
What Is Mass Timber Construction?
Mass timber, sometimes referred to as Cross Laminated Timber, consists of multiple layers of dried lumber stacked in alternating directions and bound together with structural adhesives and pressed to form a single panel. The panels are specifically engineered to meet the high strength ratings of load bearing walls, floors and roof trusses and are often produced on-site. The resulting mass timber panels are significantly lighter than both concrete and steel (on average 1/5th the weight of steel beams) while maintaining a stronger strength to weight ratio.
Current building codes for mass timber projects vary across different countries, but recent legislation in the United States and Canada has allowed for construction of mass timber buildings up to 18 stories tall. Other markets, such as parts of Europe and Australia, are seeing even more progressive mass timber building requirements with a new 40-story mass timber building in Sydney being designed and scheduled to start construction in 2023.
Building and Environmental Advantages of Mass Timber
Environmental Impact:
Mass timber decomposes at a natural rate when discarded as opposed to waste from concrete or steel.
One cubic meter of mass timber sequesters roughly one ton of CO2.
In a full lifecycle analysis of mass timber vs reinforced concrete on a mid-rise building, mass timber represented a 26% reduction in global warming potential.
Mass timber construction as an alternative to steel reduces CO2 emissions by 1.9 metric tons per cubic meter of wood product
Tensile Strength: Timber supports its own weight at a higher degree than both steel and concrete.
Electrical & Heat Resistance: Natural resistance to electrical conduction when dried to standard moisture levels. Strength and dimensions are not significantly affected by heat, providing stability to the finished building.
Sound Absorption: Acoustic properties make it ideal for minimizing echo in living or office spaces. Wood absorbs sound, rather than reflecting or amplifying it.
Economic Feasibility of WS2 and Mass Timber Construction
David Ockenden, GDI’s Head of Development, explains the similarly robust economic benefits of the mass timber build due to the expedited construction timeline and relatively light material. Namely, the tensile strength of mass timber allowed for a larger construction footprint than previously thought on the WS2 building:
“When we initially started looking at traditional concrete structures it [could] only be two stories, but timber, when we started exploring that we could build a lot more and reinvest in the precinct to upgrade it.”
The demand for sustainable assets is especially high in Perth, a city known for commodity extraction, where companies are often seeking ways to improve their ESG impacts. GDI is already seeing strong leasing interest from potential full-building, multi-floor and single-floor tenants, claiming overwhelming praise and popularity of the WS2 project. When fully completed, the WS2 building will be a flagship office space within GDI’s portfolio and will serve as the basis for continued mass timber development throughout Western Australia. As mentioned above and in their recent Managing Director’s update, GDI has identified other projects where they plan to use timber construction in their recent update and are exploring redevelopment opportunities at 1 Mill Street and the Wellington car park. Their presentation cites that development approvals have been lodged or are in the process of being lodged.
Benefits of Investing in Mass Timber Projects
At B&I Capital, an Asset Manager with offices in Zurich, Singapore and Austin focused on listed real estate investing, we strive to integrate Environmental, Social, and Governance criteria throughout our investment process and company operations. We believe mass timber construction projects, such as WS2, align directly with our aim to minimize environmental footprint by lowering scope one and two emissions as much as possible. Moreover, given timber construction permitted significant increase in net leasable area and has a quicker construction time, timber construction led to a better economic return. The strong reduction in carbon emissions due to their construction will lower their need to purchase green power or carbon credits to achieve net zero for WS2. Our investment in GDI follows our support of their drive to build environmentally friendly projects and belief of their viability as strong real estate investments. It is through our investments in companies like GDI we actively participate in the creation of a sustainable future.
Retail Rebound: How Retail Real Estate Fared During the Great Pandemic Stress Test (Cushman & Wakefield)
Almost three years after the onset of the global pandemic, the retail industry has been through one the biggest stress tests imaginable, but best-in-class real estate has remained robust – and even emerged stronger in some markets.
Cushman & Wakefield’s flagship Main Streets Across the World report tracks the top retail districts across 92 cities and ranks the most expensive by prime rental value. An annual report until 2019, this year’s report is the first since then, allowing insight into comparative performance pre- and post-pandemic.
Rent Growth Highlights
Rents across global prime retail destinations declined by 13% on average during the depth of the pandemic but have rebounded to just 6% below pre-pandemic levels.
The Americas, thanks largely the to the U.S., was the most resilient region – on average rents now sit at a 15% premium to pre-pandemic levels.
In Asia Pacific rents fell on average by 17%, impacted by international border closures, which curbed tourism in prime locations.
Global Rankings
New York’s Upper Fifth Avenue moves up one spot to number one, now ranks as the most expensive retail destination in the world.
Hong Kong has slipped to second place, with Tsim Sha Tsui overtaking Causeway Bay as the most expensive precinct in the city-state.
Via Montenapoleone in Milan has jumped two positions to achieve third place, followed by London’s New Bond Street and The Avenues des Champs Elysees in Paris rounding out the top five.
This quarter, the Knight Frank Data Centre report focuses on the growth markets of Asia Pacific. Market analysis includes Osaka, Melbourne, Jakarta, Manila, Hanoi, Taipei, and Indian cities Hyderabad, New Delhi and Chennai.
The growth trajectory of data centre supply noted in the principal global data centre markets in previous quarters is now being mirrored in secondary cities across the region. Underpinned by strong demand fundamentals and a trend towards greater localisation of data centre facilities, total supply (live, under construction, and committed capacity) in the reported APAC markets has grown from just under 700MW five years ago to over 3,000MW today. For the first three quarters of 2022 alone, around 600MW of new capacity has been added.
Melbourne, Jakarta and Osaka now each have over half a gigawatt of aggregate IT Supply. At 593MW of registered IT supply, Melbourne is seeing renewed interest from local and regional operators such as NextDC, AirTrunk, Vantage and Stack Infrastructure, which will add close to 450MW to existing live supply. Microsoft is also known to be planning a facility here. Jakarta has seen significant announcements and planned capacity, several times the existing supply, from both hyperscale cloud service providers like Amazon and Microsoft, as well as a variety of local and international operators. Osaka continues to develop as an alternative data centre market in Japan complementing the more established Tokyo region.
The major cities of Hyderabad, New Delhi and Chennai are also registering rapid growth, with between 300MW to 400MW of IT capacity each. About two-thirds of this supply was added in the past couple of years, with around 50% of total supply planned or committed capacity. The increased investment in the data centre sector in recent years is party driven by government policy, including easier access to credit and other incentives to boost data centre investment. Active players in the market include local firms such as CtrlS, Sify Technologies, Nxtra by Airtel and Web Werks, joint ventures such as AdaniConnex and BAM Digital Realty, as well as cloud service providers.
In Southeast Asia, Taipei, Manila and Hanoi continue to see growing interest from hyperscale CSPs and data centre investors. AWS announced local zones in both Manila and Hanoi this year and is in the process of rolling them out, while the global firm also launched its local zone in Taipei in October 2022. Current key players in these markets mainly comprise the local telcos, with a handful of regional joint ventures such as STT-Globe in the Philippines and NTT-VNPT in Vietnam.
Overall, the expansion of data centre activity into the growth markets across the APAC region remain on a strong footing, reflecting the continued resilience of demand across each geography.
5 Steps to Climate Positive Real Estate (Cushman & Wakefield)
Climate positive activities are aimed at not only achieving but surpassing net zero emission goals through eradicating additional carbon dioxide (CO2) and/or greenhouse gases (GHG) from the atmosphere. In short, it’s about saving more GHG emissions than your actions produce, in order to create an environmental benefit.
When developing a climate positive strategy, the first stage is to apply a carbon accounting framework. For instance, if a building product manufacturer wants to develop a climate neutral or positive product, they must determine the total carbon footprint of that product. The carbon footprint covers everything — from the energy needed to source the original material/s as well as to produce, supply, use and dispose of the product — to the emissions related to product original material/s sourcing as well as product production, usage and disposal.
Once the total carbon footprint is calculated, as well as what needs to be counteracted to become carbon neutral, then an additional measurement number, such as an extra 10% for example, can then be tagged on to estimate what is needed to go climate positive.
How enterprises actually achieve climate positivity can differ. Usually, however, they meet the requirements via a mixture of reducing carbon emissions, shifting to renewable energy, producing locally, investing into offsetting, and purchasing carbon credits.
Transforming Your Real Estate
Buildings can realize climate-positive results in a number of ways, and simply put, the steps to climate positive are the steps to net zero plus that extra mile, whatever takes the building to remove more greenhouse gas (GHG) than it is producing. The building’s strategy should include a mixture of the following steps:
Step 1 CHOOSE: the optimal building location, design, energy modelling, eco-friendly materials, renewable energy and intelligent energy management systems
Step 2 MAXIMISE: the structural efficiency, insulation and greenhouse gas reduction systems
Step 3 MINIMISE: the material and operational wastage and water usage
EduInfra – Emergence of a new asset class (Resolut Partners)
In this article, we explore an emerging sub-set of infrastructure which is garnering increasing amounts of interest from global private equity and pension funds – Educational Infrastructure or ‘EduInfra’. EduInfra refers to the infrastructure, building and land used to deliver social services like education.
EduInfra is attractive to international annuity investors looking for stabilized yield plays. The sector has an edge over other similar asset classes due to its non-GDP linked and rather recession proof character with significant potential for capital appreciation. It offers a promising 10 – 11% entry cap rate with rental escalations in the region of 3 – 5%. While the market boasts of significant depth, potential has not been unleashed as operators are only slowly moving towards asset light models. EduInfra’s classification as infrastructure allows for tax optimal exit through InvITs which can also serve as a growth platform attracting institutional investors.
Kemmu Kawai joined Longevity Partners Japan in September 2022 as the Country Director. Based in Tokyo, he oversees all operations and activities in Japan, the Asia-Pacific region and beyond. He brings him more than 16 years of experience in finance where he specialised in real estate and credit investments. Before joining Longevity Partners, he served as a Portfolio Manager at Norinchukin Bank and as Investment Manager at Center Point Development.