
APREA Logo

Knowledge Hub

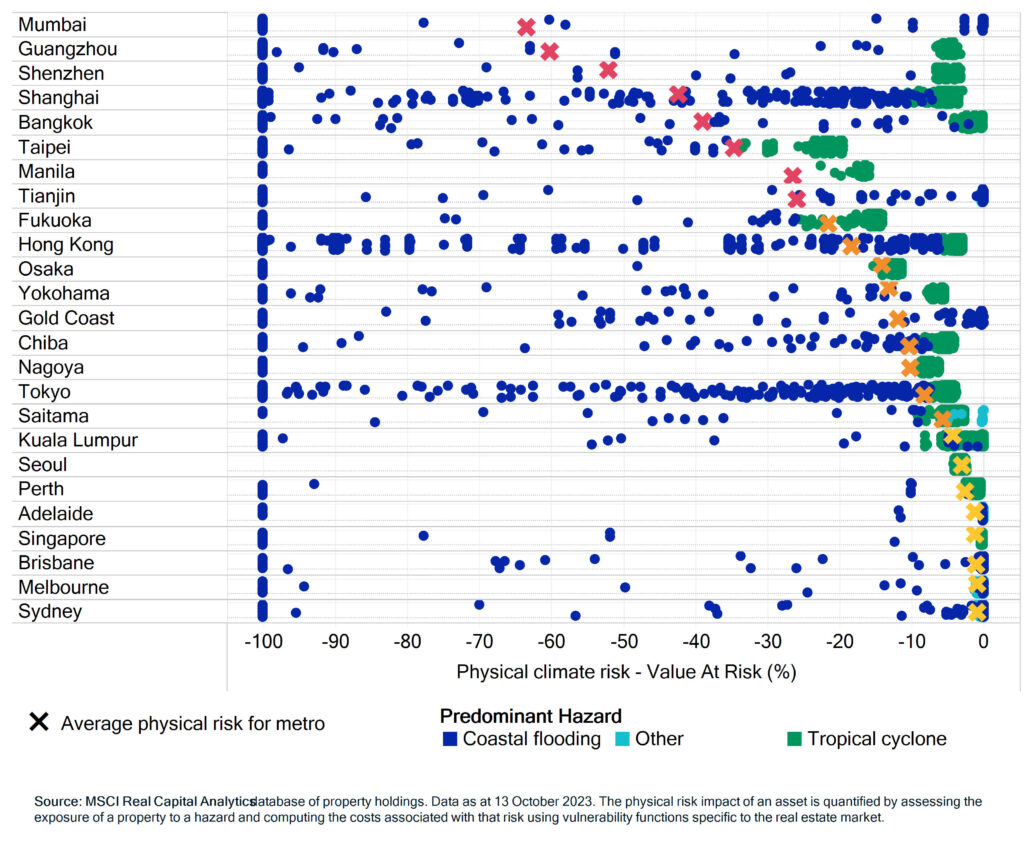
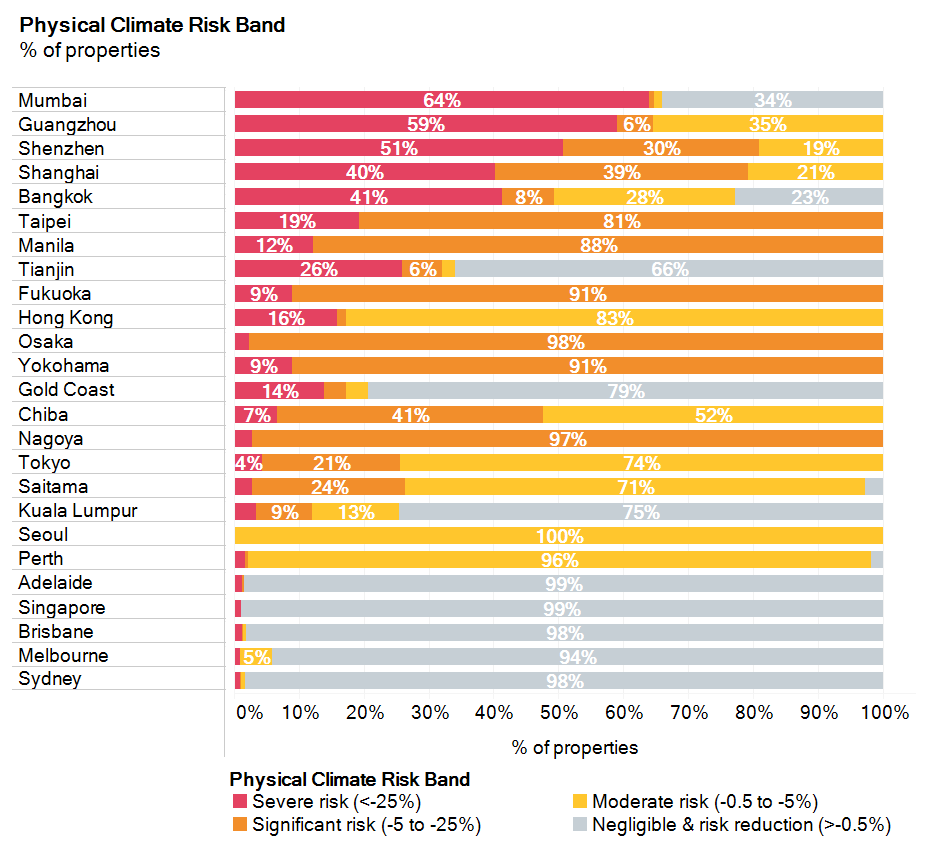
Applying climate analysis to MSCI’s Real Capital Analytics database of global property holdings, we can see a broad range of aggregated physical climate risks across real estate in selected Asia-Pacific cities. As we previously showed for cities worldwide, these risks were not equally distributed within each city.

Once again, location and topography were decisive factors behind the impact of physical climate change, reinforcing the idea that investors may wish to consider climate risk at the individual asset level, rather than relying solely on market-level data.

The charts below illustrate Average physical risk vs. risk distribution across major Asia-Pacific metros

Physical Climate Risk

Average for metro and asset-level
Physical Climate Risk Band

% of properties
Niel Harmse

Vice President
MSCI Research ×

Niel Harmse

Vice President
MSCI Research

Niel Harmse works on the real estate-solutions research team. He focuses on performance measurement, portfolio management and risk-related research for asset owners and investment managers. Prior to joining MSCI, Niel was an investment analyst at Old Mutual Property and a research analyst at Investment Property Databank. He holds a B.Com in economics and a B.Com, with honors, in econometrics from the University of Johannesburg.

According to the World Economic Forum, 80% of the buildings today will exist in 2050. The built environment is responsible for about 40% of global CO2 emissions. Retrofitting is the least capital-intensive way to make our existing buildings smarter and more efficient in order to reduce carbon emissions. It is also an effective and efficient way to drive financial outcomes capital and operational changes within the current parameters of a building’s design.

Singapore is the top source of global cross border capital for the industrial and logistics (I&L) sector, while Japan ranked fourth after Canada and the UK.

Japan and Australia are among the top 10 global destinations for cross border capital investments in I&L.

Colliers’ latest Global Capital Markets Insights and Outlook: Industrial & Logistics Report further reveals that US$26 billion worth of industrial assets have been sold across Asia Pacific year-to-date (Sept 23), with most transactions done in China, Australia, South Korea and Japan.

Despite current economic headwinds and constraints on airline seat availability, hotel performance in Asia Pacific has continued to improve in 2023.

The recovery continues to be largely driven by domestic demand, although the return of mainland Chinese tourists at the beginning of 2023 has started to trickle into neighbouring markets with greater velocity in the past quarter.

The strong performance of hotels over the past 12 months relative to other asset classes, combined with the cyclical recovery and the nature of inflation hedging, is ensuring that investor appetite for operational real estate, such as hotels, continues to strengthen. Assets in tier I countries (Australia, Japan and Singapore) alongside resort markets are performing especially well.

This report was originally published in https://www.cbre.com/insights/reports/2023-asia-pacific-hotels-hospitality

Q3 2023 Singapore Figures report provides the latest commentary and data on net absorption, rents, vacancy, supply and other key metrics in Singapore’s office, business parks, retail, residential and industrial markets, along with an analysis of real estate investment activity.

Executive Summary

Office: Year-to-date, Core CBD (Grade A) rents have increased by 1.3% in 2023. There was positive net absorption of 0.11 mil sq. ft., as compared to a more modest level of 0.03 mil sq. ft. in H1 2023.

Business Parks: Demand for business parks continued to moderate as leasing sentiment turned cautious. Rest of Island rents registered its first quarter of decline since Q1 2021.

Retail: Prime islandwide retail rents rose at a faster clip in Q3 2023 (1.4% q-o-q), compared to 0.8% q-o-q in Q2 2023.

Residential: New home sales slowed despite a larger number of new projects and units launched. Following the fall in overall private housing prices in Q2 2023, prices rebounded.

Industrial: Despite the economic headwinds, prime logistics rents have grown by 11.7% year-to-date, as limited supply of prime logistics space was met with strong leasing demand.

Investment: Preliminary real estate investment volumes in Singapore for Q3 2023 surged 93.4% q-o-q (-13.5% y-o-y) to $7.044 bn, mainly on public (mostly residential) land sales. Excluding these sites, investment volumes would be down marginally by 2.5% q-o-q.

This report was originally published in https://www.cbre.com.sg/insights/figures/singapore-figures-q3-2023

Investors have long-sought after real estate for price appreciation, inflation protection and diversification.

There are a variety of ways to access real estate, including the private route, direct investment in brick-and-mortar properties, debt investments backed by real estate, publicly traded Real Estate Investment Trusts (REITs) and securities, and securitised fixed income instruments. Arguably the most optimal approach is to combine these approaches’ complementary benefits by following what CBRE terms as the ‘Four Quadrants’ approach.

The Four Quadrants approach involves four primary investment conduits through which institutional investors can obtain exposure to commercial real estate. These are:

  • Private Equity
  • Public Equity
  • Private Debt
  • Public Debt

This report reviews the Asia Pacific real estate investment landscape across these four quadrants, and shares insights on potential opportunities and strategies for investors.

This report was originally published in https://www.cbre.com/insights/reports/asia-pacific-four-quadrants

Explore the Q3 2023 report on India’s commercial office and residential sectors. Commercial leasing hits 16 MSF, while the residential market maintains robust sales, but affordable housing demand decreases.

  • Residential demand in Q3 2023 trended up significantly to 82,612 units, 12% higher in YoY terms and 7% higher compared to the preceding quarter.
  • It is particularly noteworthy considering that it also constitutes an almost six-year high in quarterly sales volumes. Sales traction was higher across all markets in YoY terms.
  • Price levels have also grown in tandem with demand across all markets in YoY terms. Price levels in Hyderabad saw the most significant rise at 11% YoY as focus increasingly shifts toward the development of premium high-rise properties.

A fast-evolving landscape of geopolitical tension, elevated inflation, rising interest rates, and shifting policy developments presents both challenges and opportunities for investors navigating a wave of transformative change in international asset classes. In particular, as investment funds move to revise their strategies, the dynamic real estate (RE) markets of the Asia Pacific (APAC) are now drawing increasing attention, as managers seek to tap their historically strong track record for growth as well as their potential for portfolio diversification at a time of rising levels of market risk.

This report was originally published in https://www.capitaland.com/en/about-capitaland/newsroom/Perspectives/2023/Benefits-of-Diversity-APAC-Role-in-Investment-Portfolio-Growth.html

  • Worries about artificial intelligence (AI) supplanting knowledge workers have created more pain for the office market.
  • A broader view on the economic impact of AI should consider possible positive impacts.
  • AI could boost worker productivity and economic demand — and thus demand for other types of commercial real estate.

In Colliers’ latest report Global Capital Markets: Insights and Outlook – Global Capital Flows, Singapore tops the list of biggest global spenders so far in 2023 followed by the US. The Lion City, with cross border capital investments worth USD 21, 840 million in H12023, now represents around a quarter of the total investments and is three times bigger as a spender this year versus Canada in the third position.

Hong Kong and Japan stood out as the fourth and fifth largest source of cross-border capital, spending USD 6,508 million and USD 5,151 million respectively in the first half of this year.

The region came out equally strong as an investment destination. Japan, China, Australia and Singapore are among the top 10 investment destinations globally with healthy investment growth seen across each of these markets.